Loss Function: How Wrong Is a Line?
A model is a rule with parameters; the loss is one number for how wrong it is on the training data, and learning means making that number small.
Chapters
- Guess $29 for every ride: twenty cents off
- A small machine: a weight and a bias
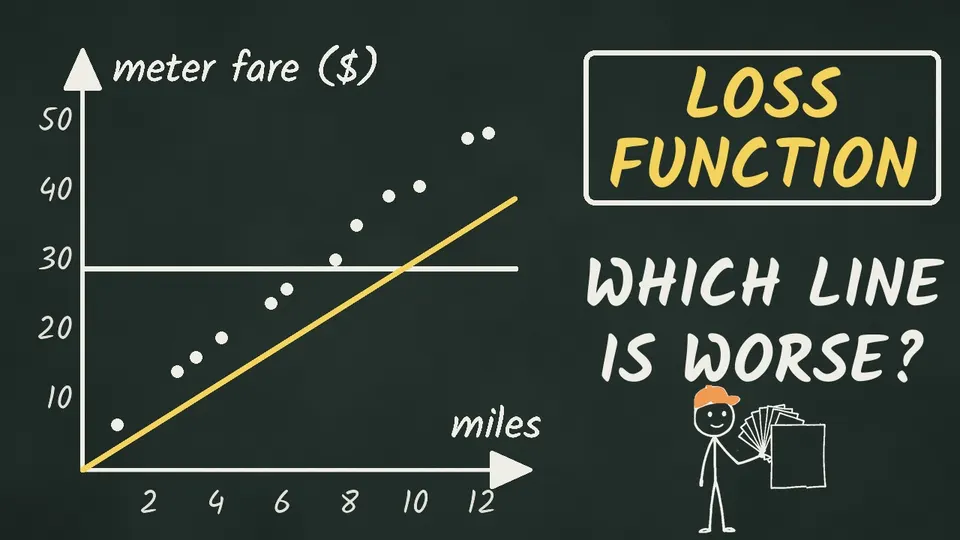
- Two lines: the first guess and a flat $29
- Add up the gaps: $100 against 20 cents
- One ride's miss
- Overs cancel unders, so square each miss
- Add the squares: the loss, 962 against 2,039
- Parameters and the model
- Numbering the rides: i, xᵢ and yᵢ
- The miss in symbols
- Sigma and the least-squares loss
- The loss function, and the lowest it can go
- Training data and supervised learning
- The one sentence, and what's next
The episode in one sentence: a model is a rule with parameters; the loss is one number for how wrong it is on the training data, and learning means making that number small.
The film's words, the textbook's, and the ones you will meet in code
| In the film | The textbook's term | Symbol | Often in code |
|---|---|---|---|
| a knob | a parameter | params, theta |
|
| the knob that multiplies the miles ("weight: $ a mile") | a weight | w |
|
| the knob that is added on top ("bias: $ to start") | a bias | b |
|
| the machine, the line | the model | model(x) |
|
| the twelve rides, each with its fare | training data | , | X, y |
| the line's fare for a ride (the estimate) | a prediction | y_pred |
|
| the real fare (the actual) | the ground truth | y |
|
| the miss | a deviation (elsewhere: an error, a residual) | y_pred - y |
|
| how wrong, in one number | the least-squares loss; the loss function, also called the cost function | loss |
|
| learning from examples with answers | supervised learning |
This sum divided by the number of rides is the mean squared error, a name you will meet in code as mse.
1. Play
Grade a line
The twelve rides and a line. Each dashed stroke is one ride's miss, with its square drawn on it. The title keeps two scores: the plain sum of the misses, and the loss (the squares added).
- line over
- +$0.00
- line under
- −$101.78
- plain sum
- −$101.78
- loss L
- 962.2
Now turn the two parameters yourself
Try to beat the first guess's loss of 962.2. No line scores under 8.35 on these rides.
Predict, then reveal
Two lines: the machine's first guess ($0 to start, $3 a mile) and the flat line ($29, every ride). Before you run the next cell, decide:
- Which line has the plain sum nearer to zero?
- Which line has the smaller loss?
Show the answer
| plain sum | loss L | |
|---|---|---|
| first guess: $0 + $3 a mile | −101.78 | 962.2 |
| flat line: $29, every ride | −0.20 | 2,039.2 |
The plain sum picks the flat line, easily: 20 cents off in all, against $101.78. By that count the flat line is about 500 times better.
The loss picks the first guess: 962.2 against 2,039.2. The flat line is more than twice as wrong, which is what your eye said from the start: it charges a one-mile ride the same as a twelve-mile ride.
The plain sum fails because a miss has a sign. The flat line is over six rides and under six, and the two totals wipe each other out. A square is never negative, so nothing cancels.
Overs cancel unders
The flat line's twelve misses as bars: up where the line is over a ride, down where it is under.
- over
- +$67.80
- under
- −$68.00
- plain sum
- −$0.20
- squares added: loss L
- 2,039.2
Slide the level. Near $29.02, the rides' average fare, the overs and the unders cancel, yet the loss is still about 2,039: no flat line does better.
2. FAQ: where students get stuck
- Why not just drop the minus signs, instead of squaring?
- What unit is the loss in?
- Is a neural network's loss always a sum of squares?
1. Why not just drop the minus signs, instead of squaring?
Show the answer
| signs dropped | squared | |
|---|---|---|
| first guess | $101.78 | 962.2 |
| flat line | $135.80 | 2,039.2 |
ride 4: a miss of $6.59, squared 43.4
ride 11: a miss of $13.12, squared 172.1 (1.99 times the miss, 3.96 times the square)
You can, and it stops the cancelling too: with the signs dropped, the first guess comes to $101.78 and the flat line to $135.80, so the flat line is still the worse one. That is a real loss with its own uses (see the first Optional section).
Squaring does one more thing: a big miss counts extra. One ride missed by $10 (a square of 100) counts as worse than two rides missed by $5 each (25 + 25 = 50); with the signs dropped, the two tie. Squares are also the easier loss to do calculus on, which the next parts lean on.
2. What unit is the loss in?
Show the answer
Dollars squared: a miss in dollars, times itself. So 962.2 is a score for comparing lines, not a price. To get back to dollars, divide by the number of rides (that is the mean squared error) and take the square root: for the first guess, about $8.95, the size of a typical miss.
3. Is a neural network's loss always a sum of squares?
Show the answer
No. A network that names pictures uses a different recipe, built for answers that are a category and not a number (the textbook's chapter 5). The job is the same: one number for the whole training set, and lower is less wrong. "Loss" and "cost" are two names for the same idea.
3. Practice
Five problems in the textbook's notation, easiest first. Try each on paper, then click to check.
Problem 1.
The first guess is with and . Ride 4 is miles and dollars. Find the line's fare for that ride, the miss, and its square.
Show the answer
- The line's fare: .
- The miss, the line's fare minus the real fare: . Negative: the line is under the dot.
- Its square: dollars squared (43.4 on the film's board). A minus goes in, a plus comes out.
Problem 2.
Three rides, as (miles, dollars): , , . Model A has , . Model B is a flat line, , . For each, find the three misses, their plain sum, and the least-squares loss . Which model does the plain sum prefer? Which does the loss prefer?
Show the answer
- Model A's fares: , , . Its misses: , , . Plain sum: . Loss: .
- Model B's fare is 11 every time. Its misses: , , . Plain sum: . Loss: .
- The plain sum calls B perfect: 11 is the average of 7, 10 and 16, so its overs and unders cancel exactly. The loss calls A more than eight times better (5 against 42), and A is the line that follows the rides.
Problem 3.
On the film's twelve rides, line A is $0 to start and $4.00 a mile; line B is $5 to start and $3.50 a
mile. Guess which has the lower loss, then find both (set the two sliders in section 1, or type
loss(0, 4.0), loss(5, 3.5) in a new cell).
In the demo: set line A · set line B
Show the answer
- for A is 45.9 and for B it is 21.3, so B is the less wrong of the two. Both are far below the first guess's 962.2.
- Why B: A is under ten of the twelve rides, and its misses add to −$19.64. B is over the seven shortest rides and under the five longest, and its misses add to −$0.71. Here the plain sum and the loss agree; the flat line showed that they do not have to.
Problem 4.
The film's loss adds over 12 rides. Write the least-squares loss for rides (the textbook's letter for how many), first with , then for a line. What is left of it for a flat line, ?
Show the answer
- With the model's name: .
- For a line, , so . Only the number on top of the sigma changed.
- For a flat line the miles drop out: . Every ride gets the same fare, , whatever its miles.
Problem 5.
A neuron with three inputs computes . (Here the small numbers on count the inputs of one example, not the rides.) Which parameters are weights, which is the bias, and how many parameters are there? With , , , and inputs , , , what comes out?
Show the answer
- The weights are , and : each multiplies an input. The bias is : it is added and multiplies nothing. Four parameters in all.
- Multiply and add: . Then the bias: .
- A bias of −5 does the job of a bar of 5 (the total clears the bar when the total minus 5 is at least 0): this total sits exactly on the bar.
4. One open question
You can now grade any line. From the first guess, with its loss of 962.2: which way should each parameter turn to make the loss fall? With two sliders you can try a nudge and look. What would you do for a model with thousands of parameters and no sliders, where trying every setting is out of the question?
That is the question Deep Learning 1.2 answers, with gradient descent.
Optional: the loss without squares
A side trip: what the other recipe from FAQ 1 prefers.
Drop the signs and add: , the sum of absolute deviations. For flat lines the two recipes pick different levels. Least squares is lowest at the average fare, $29.02. The sum of absolute deviations is lowest at the median, the middle of the fares: any level between the two middle fares, $26.10 and $30.30, scores the same $135.80. A few very large misses pull the average, and so pull a least-squares line; they barely move the median. That is the "big miss counts extra" of FAQ 1 again, seen from the other side.
flat lines: squares added
flat lines: signs dropped, added
Optional: how the twelve rides were drawn
A side trip into the data.
The rides come from the New York City Taxi & Limousine Commission's public trip records for yellow taxis, January
2024: 2,964,624 trips. Kept: the standard rate, a positive fare, more than 0.2 and under 15 miles, between 1 and 90
minutes; that leaves 2,568,686 rides. The fare is the file's fare_amount: the meter's fare, before tip, tolls and
surcharges.
The film keeps the rides that averaged over 20 miles an hour, 165,041 of them, so that the fare follows the miles as closely as real rides allow (why speed matters to a meter is Deep Learning 1.2's story). The twelve on the board are one ride picked at random from each one-mile band between 1 and 13 miles, and they are numbered from the shortest, 1.04 miles for $6.50, to the longest, 12.20 miles for $48.50.
Twelve rides are few. They are enough to show how a line is graded; whether a line that scores well on its twelve rides also knows the next ride is a later part's question.
From the film
Where this sits: Deep Learning 1.1. It can be watched on its own. The order: Deep Learning 1 (the Big Idea, what a neural network is), then the Deep Dives 1.1 the loss function (this one), 1.2 gradient descent, 1.3 the loss landscape and 1.4 underfitting, then Deep Learning 2 (Big Idea). Playlist: DEEP DIVE: Deep Learning.
Textbook: Simon J.D. Prince, Understanding Deep Learning (MIT Press, 2023), chapter 2: §2.1 to §2.2.2.
Next: we can grade any line. Which way should each parameter turn to make the loss fall? That is Deep Learning 1.2, gradient descent.
Sources
- The rides: NYC Taxi & Limousine Commission, Trip Record Data, yellow taxis, January 2024. The film's twelve are standard-rate rides that averaged over 20 mph, one drawn at random from each one-mile band from 1 to 13 miles; the fare is the meter's fare (fare_amount), before tip, tolls and surcharges. $29 is their average fare to the dollar.https://d37ci6vzurychx.cloudfront.net/trip-data/yellow_tripdata_2024-01.parquet
- The model, the loss, the notation and the terms: Prince, Understanding Deep Learning, §1.1 (supervised learning), §2.1 to §2.2.2 (eq. 2.4 and 2.5; "we term L[φ] the loss function or cost function") and §3.4 (weights and biases)https://github.com/udlbook/udlbook/releases
- The printed loss (2.299, 2.151, 1.889, 1.550): PyTorch Tutorials, "Quickstart", the page's own output: the first line of each pass over the 60,000 FashionMNIST pictures of clothes. That network's loss is made by a different recipe (cross-entropy), with the same job: one number, lower is less wrong.https://docs.pytorch.org/tutorials/beginner/basics/quickstart_tutorial.html
- Every equation and number on screen is checked with NumPy in the project's check scripts.
The drawings are made with generative AI and drawn on stroke by stroke; the graphs and equations are made by code. The narration is a synthetic voice.