The Derivative: Nobody Measured Usain Bolt's Top Speed
Speed at one moment is the slope of the distance-time curve when you zoom in until it looks straight; that slope is the derivative.
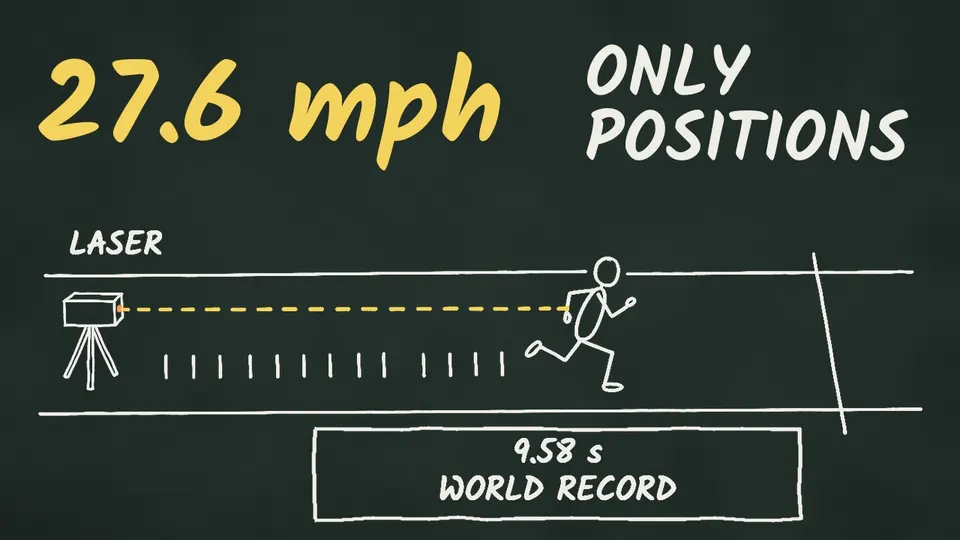
Usain Bolt ran 100 meters in 9.58 seconds in Berlin in 2009, the men's 100 m world record. Lasers behind the blocks recorded only where he was, up to 100 times a second. His top speed, 27.6 mph (12.34 m/s at about 68 m), was worked out from those positions: the World Athletics biomechanics team smoothed the laser distances and differentiated them.
This episode does the same thing with pictures. The race becomes a curve through the official 10 m split times. A triangle on that curve shows why its slope is a speed: the run is the time that passed, the rise is the meters covered, rise over run is meters per second. Zoom in on any smooth curve and it starts to look straight, with one slope. Then pull a line's two ends in toward 68 meters and watch its slope settle near 12.3. Where you meet the same idea: your car's speedometer, average-speed cameras, the slope of a hill. And the question it leaves: the ends got close but never met, so how can there be an exact answer?
Watch the Short of this episode on YouTube
Go deeper
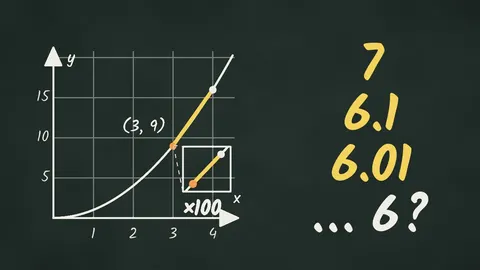 Deep Dive 1.1The Limit: Is the Slope 6, or Nothing?The derivative isn't the slope of any chord; it's the number the chord slopes head for, found by doing the algebra while the gap is still not zero.
 Deep Dive 1.2The Power Rule: Why the Power Comes DownMultiply out the rise, (x + h)ⁿ − xⁿ, and every term but one carries an extra h; the limit keeps only n·xⁿ⁻¹.
From the film
Where this sits: Calculus 1, the Big Idea of the derivative. The Deep Dive that takes it further is Calculus 1.1: the limit (link to follow once it is published).
Sources
- Laser distance measurement (LAVEG at 50 Hz, LEM 300 at 100 Hz, about 15 m behind the blocks), velocities calculated by differentiating the filtered distances, the 10 m split times, the reaction time (0.146 s) and the maximum velocity (12.34 m/s at 67.90 m): Graubner & Nixdorf, "Biomechanical Analysis of the Sprint and Hurdles Events at the 2009 IAAF World Championships in Athletics", New Studies in Athletics 26:1/2 (2011)https://worldathletics.org/download/downloadnsa?filename=31514203-6724-455e-906c-ef931384c656.pdf&urlslug=biomechanical-analysis-of-the-sprint-and-hurd
- The world record (9.58 s, Berlin, 16 August 2009): World Athletics, "Bolt again! 9.58 World record in Berlin"https://worldathletics.org/news/news/bolt-again-958-world-record-in-berlin-updat
- Wheel-speed sensors (the pulse frequency is proportional to the wheel speed): Bosch Mobilityhttps://www.bosch-mobility.com/en/solutions/sensors/wheel-speed-sensor/
- How a speedometer turns sensor pulses into a speed: Wikipedia, "Speedometer"https://en.wikipedia.org/wiki/Speedometer
- Average-speed cameras (number plates read at two sites a known distance apart): Wikipedia, "SPECS (speed camera)", and the maker's own page (Vysionics, archived 20 Oct 2013)https://en.wikipedia.org/wiki/SPECS_(speed_camera)https://web.archive.org/web/20131020060035/http://www.vysionics.com/Specs/
- The plotted curve is a smooth monotone curve (PCHIP) through the report's split times; between the dots it is not a measurement. Its tangent at 67.9 m is 12.35 m/s, against the report's 12.34. Every number in the film is checked in the project's check script.
The drawings are made with generative AI and drawn on stroke by stroke; the graphs are plotted from the report's data by code. The narration is a synthetic voice.